You are using an out of date browser. It may not display this or other websites correctly.
You should upgrade or use an alternative browser.
You should upgrade or use an alternative browser.
I'm getting a big server load with requests to Mailwizz's /dswh/{id}
frm.mwz
Well-Known Member
If you have a strong processor to operate your webserver and your database quickly (or have the dbf on a separate infrastructure) and use SSD, this should work well. You might like to use a cloud setup with autoscaling for flex cpu power, though make sure the IPs are not to cloudy (i.e. floating, which is not good for mail).I'm getting a big server load with requests to Mailwizz's /dswh/{id} I have it set up with Sparkpost.
Is there a way I could optimize this from the Mailwizz side?
twisted1919
Administrator
Staff membercorey34
Active Member
@twisted1919, I just talked to Sparkpost and they say they pull a batch once a minute, or maybe even more frequently depending on how many events there are. And each one of these has an average of 3 second response time. This really starts to add up with each new additional customer.
Here is what Sparkpost also said:
"have you reviewed these best practices? https://www.sparkpost.com/docs/tech-resources/managing-webhook-data/. a best practice is to decouple your injestion from processing. Perhaps you can load the batches in a queue for processing later? or even write to file and then process later".
Is this what is happening in MW?
I also checked how many total bounces and spam complaints there were for the last week, just to make sure there wasn't something out of the ordinary and the total of those 2 together is less than 1,000 for the last 7 days.
FYI, I am working with @Ernesto with this. We are talking about the same issue.
Thanks
twisted1919
Administrator
Staff member@corey34 - we don't have any process to save the webhook data for later processing in batches, we process them as they come in since we never had any issue doing like this so far.
The way the webhook endpoints are designed in mailwizz, you can easily decouple the existing processor and replace it with yours with whatever processing type you'd like.
Anyway less than 1000 is a very small number, so i am not sure exactly what type of load you could get from this(numbers?), if you look at the endpoint ( /apps/frontend/controllers/DswhController.php from line 987 ) you'll see that it doesn't really do much thing, maybe the only way it can cause processing is the line 998 ( $events = Yii::app()->ioFilter->xssClean($events); ) which you can comment out to see if things get better, but beside this, we just issue aroun 3-4 queries which should not be any issue at all.
corey34
Active Member
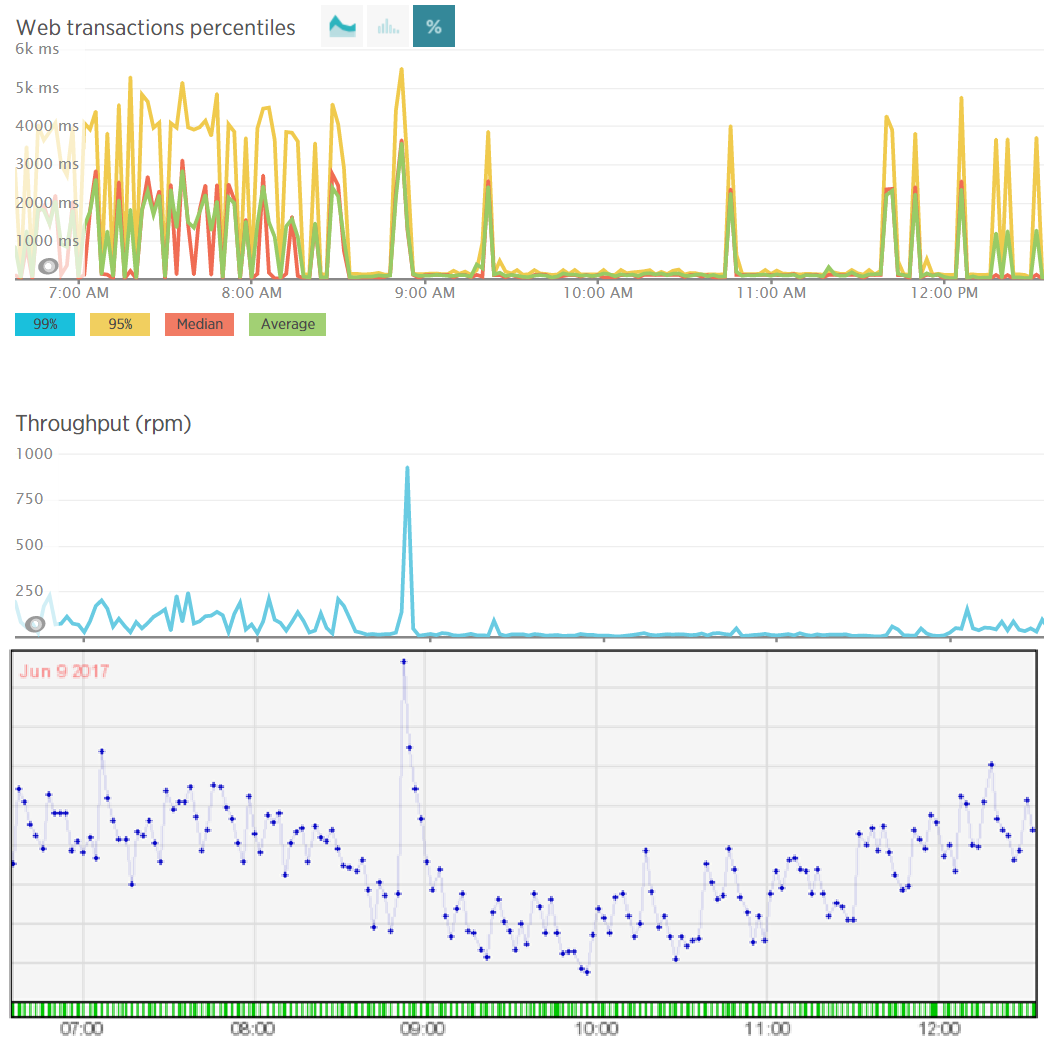
@twisted1919, I think I didn't explain myself correctly. What I was saying is that I only had 1000 spam/bounces in a week. But those pages are being called 1,000s of times per day. You can see from the 2nd graph below that there was actually 1,000 requests in one minute. Additionally, it's averaging about 3 seconds to load each time the page is requested. Those top 2 graphs are specific to the Dswh Controller
The bottom graph is my server load average. Capacity of my server is somewhere around 4-5 lines up (sorry, the numbers got cut off). You can see that my load average is correlated with the number of requests to those pages.
The bottom graph is my server load average. Capacity of my server is somewhere around 4-5 lines up (sorry, the numbers got cut off). You can see that my load average is correlated with the number of requests to those pages.
Last edited:
twisted1919
Administrator
Staff membercorey34
Active Member
Sure, here is the image again. Did it work this time?
I talked with Sparkpost and they said they call the page once per minute, or more depending on how if they need to call it more. So if I have 100 customers, Sparkpost is calling those pages at least 100 times a minute. I asked if I had the ability to change that frequency but they said I do not. That was when they then gave me that link (in my above reply) about best practices.
I talked with Sparkpost and they said they call the page once per minute, or more depending on how if they need to call it more. So if I have 100 customers, Sparkpost is calling those pages at least 100 times a minute. I asked if I had the ability to change that frequency but they said I do not. That was when they then gave me that link (in my above reply) about best practices.
twisted1919
Administrator
Staff memberThat makes sense, but only if there are events to send. By default we create the webhooks for 'bounce', 'spam_complaint', 'list_unsubscribe' and 'link_unsubscribe' events.or maybe even more frequently depending on how many events there are
Did you checked other events too ?
Only if there are events to process, events that we subscribe too, and we don't subscribe to all of them.o if I have 100 customers, Sparkpost is calling those pages at least 100 times a minute
So again, i understand that they might send many requests, but they do so when there are events to process, otherwise, they don't do it.
And given the events we have subscribed to when creating the webhook, it's hard to believe they send 10k requests per minute.
Now, regardless the fact we could implement a defer system for processing the requests, the requests will still happen, so that doesn't really solve the issue of that endpoint being hit that many times.
corey34
Active Member
No, I only checked the 4 events for every customer.Did you checked other events too ?
Based on what Sparkpost was saying, they will still load the page once a minute though.Only if there are events to process, events that we subscribe too, and we don't subscribe to all of them.
So again, i understand that they might send many requests, but they do so when there are events to process, otherwise, they don't do it.
They don't send 10k a minute all the time but as you can see from the graph, it happened in one minute, one time. Unless something else is causing that page to load.it's hard to believe they send 10k requests per minute
corey34
Active Member
@twisted1919, it seems like I am either misunderstanding you or Sparkpost, and I am hoping to figure out what I'm missing so I can try to resolve this. My server is at capacity with just 100 customers and they are not heavy users (90% of them send 1-2 emails a month)
You are saying that those pages only get called by Sparkpost if there are events to process but Sparkpost is saying they do it once a minute.
Thanks
You are saying that those pages only get called by Sparkpost if there are events to process but Sparkpost is saying they do it once a minute.
What does this do? Or in other words, what won't happen if I comment it out?maybe the only way it can cause processing is the line 998 ( $events = Yii::app()->ioFilter->xssClean($events); ) which you can comment out to see if things get better,
Thanks
twisted1919
Administrator
Staff memberYes, this is my understanding.You are saying that those pages only get called by Sparkpost if there are events to process
Why? If there's nothing to post, why would they call the endpoint?but Sparkpost is saying they do it once a minute.
And even so, even if they do a health check each minute, which would be pretty dumb, if they don't send proper data for mailwizz to process, then mailwizz doesn't do a thing, it just ends the request.
So eitherway you look at this, mailwizz already does all it should do.
corey34
Active Member
Hi @twisted1919, we put this on hold due to more urgent needs but I am back to working on it.
Here is a screenshot of my server load for the last 3 days. You can see it spikes about every 8 hours. Is there something with MW that happens every 8 hours that would cause this, that is related to autoresponders?

Here is what we have found so far:
My team has been working on this for numerous hours trying to figure out the issue. Any other thoughts on where to look? Given that pausing autoresponders removed about 95% of the load on our server, it seems to be related to that but my team is out of ideas.
Thanks
Here is a screenshot of my server load for the last 3 days. You can see it spikes about every 8 hours. Is there something with MW that happens every 8 hours that would cause this, that is related to autoresponders?
Here is what we have found so far:
- Autoresponders got accidently paused for a day or so and my server load went to basically 0. That makes me believe that pretty much all the load on my server is due to autoresponders.
- We use Sparkpost subaccounts and as mentioned above, Sparkpost is making POST requests to each /dswh/* URL about 120 times a day. It doesn't seem to be the POST request itself that is causing the load. It seems to be related to what MW does when it gets the data.
My team has been working on this for numerous hours trying to figure out the issue. Any other thoughts on where to look? Given that pausing autoresponders removed about 95% of the load on our server, it seems to be related to that but my team is out of ideas.
Thanks
twisted1919
Administrator
Staff memberAutoresponders are no different than regular campaigns at sending/processing so i don't think it's the AR per se but while the AR is sending most likely sparkpost is sending data more aggresively to that endpoint.
It just does input filtering which is fine to disable a bit just to see if that affects things in any way.Above, you mentioned that we could comment out line 998 ( $events = Yii::app()->ioFilter->xssClean($events); ) of /apps/frontend/controllers/DswhController.php. Before I do that, can you explain what this line does so I know what affect it might have?
The only way i can think of, is to simply disable parts of the code till the high load goes away, then you will see what the culprit is and we can pick it from there.Any other thoughts on where to look?
corey34
Active Member
Thanks @twisted1919. I will delete that line and see what happens.
Is there something in MW that is happening every about 8 hours that causes those spikes?
Also, how exactly does MW decide if an autoresponder needs to go to a specific subscriber? Is that part of the cron that runs each minute? My thought is that the autoresponder that goes out at time interval 0 is very important to check frequently but if the time interval is, for example, 7 days, 14 days, etc, that could be checked just a couple times a day. If that's not what MW does, is that something that would be fairly simple to modify?
Thanks again
twisted1919
Administrator
Staff memberNope, not once at each 8 hours. We do have a hourly autoresponder, but i don't think that's it since it doesn't do much anyway.Is there something in MW that is happening every about 8 hours that causes those spikes?
It checks the event and the campaign_delivery_log table to make sure the subscriber did not received the email already.Also, how exactly does MW decide if an autoresponder needs to go to a specific subscriber?
Yes it is.Is that part of the cron that runs each minute?
Unfortunately that's not a good logic from a processing standpoint since you would never know when it previously ran and you would also lose the minute granularity of sending, which is very important in many cases. Anyway, the point is that these runs don't cost much in terms of performance, so i don't think that's your problem. Of course, if our findings get us there, we will look into fixing this aspect.My thought is that the autoresponder that goes out at time interval 0 is very important to check frequently but if the time interval is, for example, 7 days, 14 days, etc, that could be checked just a couple times a day.
corey34
Active Member
@twisted1919, I did more testing yesterday & today and here is what I found:
Thanks

- commenting out line 998 of /apps/frontend/controllers/DswhController.php had no effect on the server.
- At 3:00 AM I paused all the autoresponders for about 45 minutes to see what would happen. You can see from the graph that when I paused them, my server load average went to 0. When I unpaused them, it shot back up to the typical load average. I then checked to see when Sparkpost made it's POST requests. They made no POST requests from 12:42AM to 5:31AM.
Thanks
twisted1919
Administrator
Staff member")
frm.mwz
Well-Known Member
mwz usually produces the highest server usage spikes when it makes massive requests to the database, while sending poses only a comparatively little strain@twisted1919, I did more testing yesterday & today and here is what I found:
All of this seems to point to the autoresponders being the issue. Is there anything else we can do to pinpoint exactly what's going on?
- commenting out line 998 of /apps/frontend/controllers/DswhController.php had no effect on the server.
- At 3:00 AM I paused all the autoresponders for about 45 minutes to see what would happen. You can see from the graph that when I paused them, my server load average went to 0. When I unpaused them, it shot back up to the typical load average. I then checked to see when Sparkpost made it's POST requests. They made no POST requests from 12:42AM to 5:31AM.
Thanks
View attachment 3986
henkedk
Member
@twisted1919 @corey34 did you guys ever find a solution here? We're seeing 1-3 full seconds on the DSWH on the PHP side - all DB calls are done within 1-40 MS... So we're eager to figure out what's wrong with the DSWH.