nadworks
Active Member
Just wanted to fish for some ideas on a rolling report I'd like to create:
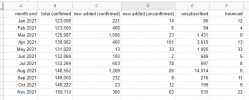
I'm working with clients on strategically growing their lists and monitoring fluctuation - unsubscribes vs. new subscribes. What's the best way to get that data out of MailWizz, maybe even by plugging in a 3rd party tool such as Google Data Studio or similar? The idea is to end up with a plus/minus time graph that shows how a list is evolving over time, incl. peaks (i.e. a sudden influx in new subscribers) and extreme troughs (i.e. when we lost a bunch for whatever reason).
This would be an amazing case study and help me work with the client to improve on database quality and growth plus make a case for strategically positioned audience growth campaigns.
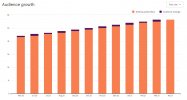
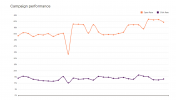
Here's an example of what MailChimp provide. I particularly like the drill-down option (top right) to select shorter or longer time spans.

Is anything like this possible w/ MW?
I'm working with clients on strategically growing their lists and monitoring fluctuation - unsubscribes vs. new subscribes. What's the best way to get that data out of MailWizz, maybe even by plugging in a 3rd party tool such as Google Data Studio or similar? The idea is to end up with a plus/minus time graph that shows how a list is evolving over time, incl. peaks (i.e. a sudden influx in new subscribers) and extreme troughs (i.e. when we lost a bunch for whatever reason).
This would be an amazing case study and help me work with the client to improve on database quality and growth plus make a case for strategically positioned audience growth campaigns.
Here's an example of what MailChimp provide. I particularly like the drill-down option (top right) to select shorter or longer time spans.

Is anything like this possible w/ MW?


